Only enterprise architects can save us from Enterprise Architecture

Enterprise architecture (EA) is a troublesome discipline. I think it’s fair to argue that the famous Bezos API mandate and the birth of AWS are both essentially enterprise architecture efforts as is Simian Army from Netflix. These efforts have clearly delivered a huge positive business impact, but it’s much harder to make that case for the version of EA that exists in government.

For this government version, if we look beyond the tendencies towards self-referential documentation, and the use of frameworks that lack empirical grounding, there is an increasingly visible conflict with a growing body of knowledge about risk and resilience that is worth considering.

In Canada, Treasury Boards Policy on Service and Digital requires the GC CIO to define an enterprise architecture while the Directive on Service and Digital requires the departmental CIOs to “align” with it.

EA is used to design a target architecture, but more people are familiar with it as a project gating mechanism where the pressure to “align” is applied to projects. Mostly this takes the form of EA arguing for centralization and deduplication largely justified by cost savings.

This focus stands in sharp contrast with the literature on resilience, which largely views this sort of cost-optimization activity as stripping a system of it’s adaptive capacity.

What’s common to all of these approaches- robustness, redundancy, and resilience, especially through diversity and decentralization- is that they are not efficient. Making systems resilient is fundamentally at odds with optimization, because optimizing a system means taking out any slack.

Deb Chachra, How Infrastructure Works

Since this stuff can feel pretty abstract, we can try to make this concrete with a look at Treasury Board’s Sign-in-Canada service which is a key part of their “target enterprise architecture”.

The Government of Canada has ~208 Departments and Agencies, 86 of which have their own accounts. This is often held up as an example of of inefficiency and duplication, and the kind of thing that EA exists to fix. As TBS describes: “Sign‑in Canada is a proposal for a unified authentication mechanism for all government digital engagement with citizens.”

If you skip past the meetings required to get all 86 systems to use Sign-in-Canada, the end result would be a “star graph” style architecture; Sign-in-Canada in the center, with digital services connecting to it.

A “star graph”. Imagine the central point as a central sign-in service, or some other shared resource (maybe a shared drive, or a firewall) with other users/systems connecting to it.

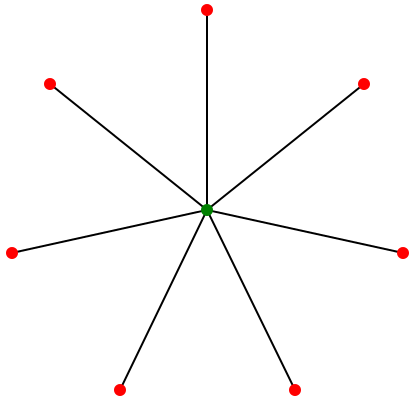
Prized for efficiency and especially for central control this star-graph style architecture shows up everywhere in governments. To get to this architecture, EA practitioners apply steady pressure in those meetings (those gating functions of Enterprise Architecture Review Boards) to avoid new sign-in systems and ensure new and existing systems connect to/leverage Sign-in-Canada.

In graph theory there is a term for networks that are formed under such conditions; “preferential attachment“, where new “nodes” in the network attach to existing popular nodes.

Networks formed under a preferential attachment model (called “scale-free” in the literature) have some really interesting (and well studied) properties that I think are exactly what EA is trying to encourage; networks formed like this are surprisingly robust to random failures.

If you imagine the power/cooling/rack space constraints of a traditional data center, and the challenge of staying within those limits while limiting the effects of random failures, the centralization/deduplication focus of EA is a huge benefit.

A demonstration from the oneline Network Science textbook of how scale free networks are surprisingly difficult to destroy by randomly removing nodes.


But “scale-free” networks also have another property: They are very fragile to targeted attack. Only a handful of highly connected nodes need to be removed before the network is completely destroyed. If targeted attacks are suddenly the concern, the preferential attachment playbook, starts to look like a problem rather than a solution.

targeted-attack
A demonstration from the Network Science textbook showing how specifically targeting central nodes quickly destroys a scale-free network.

It’s these ideas that show why an EA practice narrowly focused on reuse/centralization/deduplication ends up conflicting with resilience engineering and modern security architecture.

Through that resilience lens, the success of Sign-in-Canada means a successful hack (the Okta breach gives us a preview) could paralyze 86 government organizations, something that isn’t currently possible.

In academic terms what we’ve done is increase our systems “fragility”, it’s a well known byproduct of the kinds of optimizations that EA is tasked with making.

We need to understand that this mechanistic goal of optimization as creating this terrible fragility and that we need to try and think about how we can mitigate against this.

Paul Larcey: Illusion of Control 2023

These system/network properties are well known enough that the US military has developed an algorithm that will induce fragility in human organizations. It uses this to make networks (terror networks in their case) more vulnerable to targeted attack.

The algorithm is called “greedy fragile” and it works by selecting nodes for “removal” via “shaping operations” (you can imagine what removing someone from a social network means in a military context), so that the resulting network is more centralized (“star-like”) and fragile; centralizing as a way maximize the impact of a future attack.

Explaining the goal of military “shaping operations”, to make a network more “star-like” and fragile.

While it might sound uncharitable to lay the responsibility for systemic fragility at the feet of enterprise architecture it is literally the mandate of these groups to identify and make many of these optimizations happen. It’s worth saying the executives fixated on centralization and security’s penchant for highly centralized security “solutions” are big contributors too.

I would argue the 2022 hack of Global Affairs which brought down the entire department for over a month is an example of of this fragility. When an entire department can fail as a single unit, this is an architectural failure as much as it is a security failure; one that says a lot about the level of centralization involved.

It’s worth saying that architecting for resilience definitely still counts as “enterprise architecture”, and in that way I think EA is actually more important than ever. However as pointed out in How infrastructure Works, it would be a big shift from current practice.

“Designing infrastructural systems for resilience rather than optimizing them for and efficiency is an epistemological shift”

Deb Chachra, How Infrastructure Works

We very much need EA teams (and security architecture teams) to make that shift to focusing on resilience. The EA folks I’ve met are brilliant analysts and more than capable of updating their playbooks with ideas from complex systems, cell-based architecture, resilience patterns like the bulkhead pattern, chaos engineering, or Team-Topologies and using them to build more resilient architectures at every level: both system and organizational.

With Global Affairs, FINTRAC and RCMP all hit within a few weeks of each other here in early 2024, making resilience a priority across the government is crucial and there is nobody better placed to do that than enterprise architects.

Modernise security to modernise government

With the resignation of the CIO of the Government of Canada, the person placed at the top of the Canadian public service to fix the existing approach to IT, there is lots of discussion about what’s broken and how to fix it.

Across these discussions, one thing stands out to me: IT security always seems to get a pass in discussions of fixing/modernising IT.

This post is an attempt to fix that.

As the article about the CIO points out, “All policies and programs today depend on technology”. IT Security’s Security Assessment and Authorization (SA&A) process applies to all IT systems therefore landing on the critical path of “all policies and programs”. This one process adds a 6-24 month delay to every initiative and somehow escapes any notice or criticism at all.

If you imagine some policy research, maybe a public consultation and then implementation work, plus 6-24 months caught in the SA&A process, it should be clear that a single term in office may not be enough be able to craft and launch certain initiatives let alone see benefits from them while in office. Hopefully all political parties can agree fixing this is in their best interests.

As a pure audit process, the SA&A is divorced from the actual technical work of securing systems (strangely done by ops groups or developers, rather than by security groups) leaving lots of room to reshape this process without threatening actual security work. Improvements in this one process are probably the single most impactful change that can be made in government.

It’s also key to accelerating all other modernisation initiatives.

Everyone in Ottawa is well aware that within each department lies one or more likely political-career-ending ticking legacy IT timebombs. Whether this is the the failure of the system itself, or of the initiative launched to fix it, or even just the political fallout from fixed capacity systems failing to handle a surge in demand, every department has these and the only question is who will be in office when it happens.

Though you’d never guess, inside the government it is actually known how to build systems that can be modernised incrementally, changed quickly, rarely have user visible downtime and can expand to handle the waves of traffic without falling over.

The architecture that allows this (known as microservices) was made mandatory by TBS in the 2017 Directive on Service and Digital (A.2.3.10.2 here). The Directives successor (the Enterprise Architecture Framework) doesn’t use the term directly but requires that developers “design systems as highly modular and loosely coupled services” and several other hallmarks of microservices architecture that allow for building resilient digital services.

I think TBS was correct in it’s assessment that this architecture is key to many modernisation initiatives and avoiding legacy system replacements just as inflexible as their predecessors. Treasury Board themselves describes the difference between current practice as their target architecture as a “major shift” and once again it’s a modernisation effort blocked by security.

AWS uses the same architecture to deliver their digital services and promotes it, along with the infrastructure and team structures needed to support it, under the banner “Modern Applications“. Substantially similar advice is given by Google and others and much of these best practices have been worked into TBS’s policy since 2017.

While much of TBS IT policy has been refreshed, all core IT security guidance and patterns are built around pre-cloud ideas (ITSG 22 from 2007, ITSG 38 from 2009) and process (ITSG 33 from 2012).

While TBS might want to to adopt microservices (created circa 2010 around the “death” of SOA), it’s the 2005-era 3-tier architecture (what ITSG-38 still calls the “preferred architecture”) that the infrastructure is set up to support, rather than the fancy compute clusters and cloud functions needed for the microservices architecture.

Similar conflicts exist with the Dev(Sec)Ops and “multidisciplinary teams” needed to support their architecture which are likely not feasible given current interpretations and enforcement of ITSG-33’s AC-5 “separation of duties”.

While TBS has updated it’s policy to require agile development practices, ITSG-33, the foundation of all government security process is explicitly waterfall, and while adapting it to agile is theoretically possible, it’s developers that get exposure to agile methods, rather than the well-intentioned auditors and former network admins that populate most security groups. Surrounded by waterfall processes that no-one seems equipped to modernise, systems built around continual change flounder.

While a big part of the point of this architecture is to fix the very visible problems governments have with availability and scalability, the fixed-capacity security appliances security teams routinely place between the internet and departmental systems will undermine those benefits. No GC firewall will handle waves of traffic like AWS Lambda or Google Cloud Run, and high availability architecture won’t matter when security brings down the firewall in front to patch it.

The idea here is that in many cases modernising security it a precondition to successfully modernising anything else. For those that overlook security, the assumptions embedded in their tools, processes and architectures will subtly but steadily undermine that effort. Treasury Board is filled with smart policy analysts learning this the hard way.

Security is the base of the modernisation pyramid… start there to fix things.

ArangoDB on Kubernetes

Running a database on Kubernetes is still considered a bit of a novelty, but ArangoDB has been doing exactly that as part of their managed service, and has released the Kube-ArangoDB operator they built to do it, so we can do it too.

I found there was a bit of a learning curve with Kube-ArangoDB, so the idea here is to try to flatten it a bit for others. To do that I’ve created a repo showing a sane single instance setup using Kustomize and Minikube.

Kustomizing Kube-ArangoDB

The key file in that repo is the kustomization.yaml file. Kube-ArangoDB installs into the default namespace, so we’re using kustomize’s namespace option to ensure that everything ends up in the db namespace.

The main event is the resources: we’re pulling Kube-ArangoDB directly from GitHub and adding two files of our own.

The in the replicas section we’re just saying to run only a single instance of the various operators (since we’re running a single instance of the database).

And finally, we’re saying a secret called arangodb from a .env file.

apiVersion: kustomize.config.k8s.io/v1beta1
kind: Kustomization
namespace: db
resources:
- db-namespace.yaml
- arangodeployment.yaml
- https://raw.githubusercontent.com/arangodb/kube-arangodb/1.1.3/manifests/arango-crd.yaml
- https://raw.githubusercontent.com/arangodb/kube-arangodb/1.1.3/manifests/arango-deployment.yaml
- https://raw.githubusercontent.com/arangodb/kube-arangodb/1.1.3/manifests/arango-storage.yaml
- https://raw.githubusercontent.com/arangodb/kube-arangodb/1.1.3/manifests/arango-deployment-replication.yaml
replicas:
- name: arango-deployment-replication-operator
  count: 1
- name: arango-deployment-operator
  count: 1
- name: arango-storage-operator
  count: 1
secretGenerator:
- envs:
  - arangodb.env
  name: arangodb
  namespace: db
generatorOptions:
  disableNameSuffixHash: true

In the secretGenerator section, we told Kustomize to expect a .env file in the directory, so we should create that next. The values in that file will be used as the credentials for the root user.

cat < arangodb.env
username=root
password=test
EOF

Running it

The the setup complete, we’ll start minikube, and build and apply the config.

minikube start
kustomize build . | kubectl apply -f -

You can watch the creation of the pods and pvc, and when it looks like this, you’ll know it’s ready.

$ kubectl get po,pvc -n db
NAME                                                          READY   STATUS    RESTARTS   AGE
pod/arango-deployment-operator-7c54bb947-67qdn                1/1     Running   0          3m49s
pod/arango-deployment-replication-operator-558b49f785-k99hf   1/1     Running   0          3m49s
pod/arango-storage-operator-68fb5f6949-zzf4c                  1/1     Running   0          3m49s
pod/arangodb-sngl-miotcqdv-435cf0                             2/2     Running   0          3m9s

NAME                                             STATUS   VOLUME                                     CAPACITY   ACCESS MODES   STORAGECLASS   AGE
persistentvolumeclaim/arangodb-single-miotcqdv   Bound    pvc-71fee7f0-2387-4985-a551-a79ab8671a34   10Gi       RWO            standard       3m9s

With that running, you can connect to the admin interface by forwarding the ports to your local machine. The name of the pod will be different for you.

kubectl port-forward -n db svc/arangodb 8529:8529
Forwarding from 127.0.0.1:8529 -> 8529
Forwarding from [::1]:8529 -> 8529

With that you should be able to connect to localhost:8529, with the credentials you gave above.

That was easy

I didn’t find Kube-ArangoDB super approachable at first. After piecing a few things together and a few reps, I’m really impressed with the how easy it is to get my favourite database up and running in Kubernetes.

A look at Overlay FS

Lots has been written about how Docker combines linux kernel features like namespaces and cgroups to isolate processes. One overlooked kernel feature that I find really interesting is Overlay FS.

Overlay FS was built into the kernel back in 2014, and provides a way to “present a filesystem which is the result over overlaying one filesystem on top of the other.”

To explore what this means, lets create some files and folders to experiment with.

$ for i in a b c; do mkdir "$i" && touch "$i/$i.txt"; done
$ mkdir merged
$ tree
.
├── a
│   └── a.txt
├── b
│   └── b.txt
├── c
│   └── c.txt
└── merged

4 directories, 3 files

At this point we can use Overlay FS to overlay the contents of a, b and c and mount the result in the merged folder.

$ sudo mount -t overlay -o lowerdir=a:b:c none merged
$ tree
.
├── a
│   └── a.txt
├── b
│   └── b.txt
├── c
│   └── c.txt
└── merged
    ├── a.txt
    ├── b.txt
    └── c.txt

4 directories, 6 files
$ sudo umount merged

With merged containing the union of a,b and c suddenly the name “union mount” makes a lot of sense.

If you try to write to the files in our union mount, you will discover they are not writable.

$ echo a > merged/a.txt
bash: merged/a.txt: Read-only file system

To make them writable, we will need to provide an “upper” directory, and an empty scratch directory called a “working” directory. We’ll use c as our writable upper directory.

$ mkdir working
$ sudo mount -t overlay -o lowerdir=a:b,upperdir=c,workdir=working none merged

When we write to a file in one of the lower directories, it is copied into a new file in the upper directory. Writing to merged/a.txt creates a new file with a different inode than a/a.txt in the upper directory.

$ tree
.
├── a
│   └── a.txt
├── b
│   └── b.txt
├── c
│   └── c.txt
├── merged
│   ├── a.txt
│   ├── b.txt
│   └── c.txt
└── working
    └── work [error opening dir]

6 directories, 6 files
$ echo a > merged/a.txt
$ tree --inodes
.
├── [34214129]  a
│   └── [34214130]  a.txt
├── [34217380]  b
│   └── [34217392]  b.txt
├── [34217393]  c
│   ├── [34737071]  a.txt
│   └── [34211503]  c.txt
├── [34217393]  merged
│   ├── [34214130]  a.txt
│   ├── [34217392]  b.txt
│   └── [34211503]  c.txt
└── [34737069]  working
    └── [34737070]  work [error opening dir]

6 directories, 7 files

Writing to merged/c.txt modifies the file directly, since c is our writable upper directory.

$ echo c > merged/c.txt
$ tree --inodes
.
├── [34214129]  a
│   └── [34214130]  a.txt
├── [34217380]  b
│   └── [34217392]  b.txt
├── [34217393]  c
│   ├── [34737071]  a.txt
│   └── [34211503]  c.txt
├── [34217393]  merged
│   ├── [34214130]  a.txt
│   ├── [34217392]  b.txt
│   └── [34211503]  c.txt
└── [34737069]  working
    └── [34737070]  work [error opening dir]

6 directories, 7 files

After a little fooling around with Overlay FS, the GraphDriver output from docker inspect starts looking pretty familiar.

$ docker inspect node:alpine | jq .[].GraphDriver.Data
{
  "LowerDir": "/var/lib/docker/overlay2/b999fe6781e01fa651a9cb42bcc014dbbe0a9b4d61e242b97361912411de4b38/diff:/var/lib/docker/overlay2/1c15909e91591947d22f243c1326512b5e86d6541f83b4bf9751de99c27b89e8/diff:/var/lib/docker/overlay2/12754a060228233b3d47bfb9d6aad0312430560fece5feef8848de61754ef3ee/diff",
  "MergedDir": "/var/lib/docker/overlay2/25aba5e7a6fcab08d4280bce17398a7be3c1736ee12f8695e7e1e475f3acc3ec/merged",
  "UpperDir": "/var/lib/docker/overlay2/25aba5e7a6fcab08d4280bce17398a7be3c1736ee12f8695e7e1e475f3acc3ec/diff",
  "WorkDir": "/var/lib/docker/overlay2/25aba5e7a6fcab08d4280bce17398a7be3c1736ee12f8695e7e1e475f3acc3ec/work"
}

We can use these like Docker does to mount the file system for the node:alpine image into our merged directory, and then take a peek to see the nodejs binary that image includes.

$ lower=$(docker inspect node:alpine | jq .[].GraphDriver.Data.LowerDir | tr -d \")
$ upper=$(docker inspect node:alpine | jq .[].GraphDriver.Data.UpperDir | tr -d \")
$ sudo mount -t overlay -o lowerdir=$lower,upperdir=$upper,workdir=working none merged
$ ls merged/usr/local/bin/
docker-entrypoint.sh  node  nodejs  npm  npx  yarn  yarnpkg

From there we could do a partial version of what Docker does for us, using the unshare command to give a process it’s own mount namespace and chroot it to the merged folder. With our merged directory as it’s root, running ls /usr/local/bin command should give us those node binaries again.

$ sudo unshare --mount --root=./merged ls /usr/local/bin
docker-entrypoint.sh  nodejs                npx                   yarnpkg
node                  npm                   yarn

Seeing Overlay FS and Docker’s usage of it has really helped flesh out my mental model of containers. Watching docker pull download layer after layer has taken on a whole new significance.

Kubernetes config with Kustomize

If you are working with Kubernetes, it’s pretty important to be able to generate variations of your configuration. Your production cluster probably has TLS settings that won’t make sense in while testing locally in Minikube, or you’ll have service types that should be NodePort here and LoadBalancer there.

While tools like Helm tackle this problem with PHP style templates, kustomize offers a different approach based on constructing config via composition.

With each piece of Kubernetes config uniquely identified, composite key style, through a combination of kind, apiVersion and metadata.name, kustomize can generate new config by patching one yaml with others.

This lets us generate config without wondering what command line arguments a given piece of config might have been created from, or having turing complete programming languages embedded in it.

This sounds a little stranger than it is, so let’s make this more concrete with an example.

Lets say you clone a project and see kustomization.yaml files lurking in some of the subdirectories.

mike@sleepycat:~/projects/hello_world$ tree
.
├── base
│   ├── helloworld-deployment.yaml
│   ├── helloworld-service.yaml
│   └── kustomization.yaml
└── overlays
    ├── gke
    │   ├── helloworld-service.yaml
    │   └── kustomization.yaml
    └── minikube
        ├── helloworld-service.yaml
        └── kustomization.yaml

4 directories, 7 files

This project is using kustomize. The folder structure suggests that there is some base configuration, and variations for GKE and Minikube. We can generate the Minikube version with kubectl kustomize overlays/minikube.

This actually shows one of the nice things about kustomize, you probably already have it, since it was built into the kubectl command in version 1.14 after a brief kerfuffle.

mike@sleepycat:~/projects/hello_world$ kubectl kustomize overlays/minikube/
apiVersion: v1
kind: Service
metadata:
  labels:
    app: helloworld
  name: helloworld
spec:
  ports:
  - name: "3000"
    port: 3000
    protocol: TCP
    targetPort: 3000
  selector:
    app: helloworld
  type: NodePort
status:
  loadBalancer: {}
...more yaml...

If you want to get this config into your GKE cluster, it would be as simple as kubectl apply -k overlays/gke.

This tiny example obscures one of the other benefits of kustomize: it sorts the configuration it outputs in the following order to avoid dependency problems:

  • Namespace
  • StorageClass
  • CustomResourceDefinition
  • MutatingWebhookConfiguration
  • ServiceAccount
  • PodSecurityPolicy
  • Role
  • ClusterRole
  • RoleBinding
  • ClusterRoleBinding
  • ConfigMap
  • Secret
  • Service
  • LimitRange
  • Deployment
  • StatefulSet
  • CronJob
  • PodDisruptionBudget

Because it sorts it’s output this way, kustomize makes it far less error prone to get your application up and running.

Setting up your project to use kustomize

To get your project set up with kustomize, you will want a little more than the functionality built into kubectl. There are a few ways to install kustomize, put I think the easiest (assuming you have Go on your system) is go get:

go get sigs.k8s.io/kustomize

With that installed, we can create some folders and use the fd command to give us the lay of the land.

$ mkdir -p {base,overlays/{gke,minikube}}
$ fd
base
overlays
overlays/gke
overlays/minikube

In the base folder we’ll need to create a kustomization file some config. Then we tell kustomize to add the config as resources to be patched.

base$ touch kustomization.yaml
base$ kubectl create deployment helloworld --image=mikewilliamson/helloworld --dry-run -o yaml > helloworld-deployment.yaml
base$ kubectl create service clusterip helloworld --tcp=3000 --dry-run -o yaml > helloworld-service.yaml
base$ kustomize edit add resource helloworld-*

The kustomize edit series of commands (add, fix, remove, set) all exist to modify the kustomization.yaml file.

You can see that kustomize edit add resource helloworld-* added a resources: key with an array of explicit references rather than an implicit file glob.

$ cat base/kustomization.yaml
apiVersion: kustomize.config.k8s.io/v1beta1
kind: Kustomization
resources:
- helloworld-deployment.yaml
- helloworld-service.yaml

Moving over to the overlays/minikube folder we can do something similar.

minikube$ touch kustomization.yaml
minikube$ kubectl create service nodeport helloworld --tcp=3000 --dry-run -o yaml > helloworld-service.yaml
minikube$ kustomize edit add patch helloworld-service.yaml
minikube$ kustomize edit add base ../../base

Worth noting is the base folder where kustomize will look for the bases to apply the patches to. The resulting kustomization.yaml file looks like the following:

$ cat overlays/minikube/kustomization.yaml
apiVersion: kustomize.config.k8s.io/v1beta1
kind: Kustomization
patchesStrategicMerge:
- helloworld-service.yaml
bases:
- ../../base

One final jump into the overlays/gke folder gives us everything we will need to see the difference between two configs.

gke$ kubectl create service loadbalancer helloworld --tcp=3000 --dry-run -o yaml > helloworld-service.yaml
gke$ touch kustomization.yaml
gke$ kustomize edit add base ../../base
gke$ kustomize edit add patch helloworld-service.yaml

Finally we can generate the two different configs and diff them to see the changes.

$ diff -u --color <(kustomize build overlays/gke) <(kustomize build overlays/minikube/)
--- /dev/fd/63	2019-05-31 21:38:56.040572159 -0400
+++ /dev/fd/62	2019-05-31 21:38:56.041572186 -0400
@@ -12,7 +12,7 @@
     targetPort: 3000
   selector:
     app: helloworld
-  type: LoadBalancer
+  type: NodePort
 status:
   loadBalancer: {}
 ---

It won't surprise you that what you see here is just scratching the surface. There are many more fields that are possible in a kustomization.yaml file, and nuance in what should go in which file given that kustomize only allows addition not removal.

The approach kustomize is pursuing feels really novel in a field that has been dominated by DSLs (which hide the underlying construct) and templating (with the dangers of embedded languages and concatenating strings).

Working this way really helps deliver on the promise of portability made by Kubernetes; Thanks to kustomize, you’re only a few files and a `kustomize build` away from replatforming if you need to.

Exploring GraphQL(.js)

When Facebook released GraphQL in 2015 they released two separate things; a specification and a working implementation of the specification in JavaScript called GraphQL.js.

GraphQL.js acts as a “reference implementation” for people implementing GraphQL in other languages but it’s also a polished production-worthy JavaScript library at the heart of the JavaScript GraphQL ecosystem.

GraphQL.js gives us, among other things, the graphql function, which is what does the work of turning a query into a response.

graphql(schema, `{ hello }`)
{
  "data": {
    "hello": "world"
  }
}

The graphql function above is taking two arguments, one is the { hello } query, the other, the schema could use a little explanation.

The Schema

In GraphQL you define types for all the things you want to make available.
GraphQL.org has a simple example schema written in Schema Definition Language.

type Book {
  title: String
  author: Author
  price: Float
}

type Author {
  name: String
  books: [Book]
}

type Query {
  books: [Book]
  authors: [Author]
}

There are a few types we defined (Book, Author, Query) and some that GraphQL already knew about (String, Float). All of those types are collectively referred to as our schema.

You can define your schema with Schema Definition Language (SDL) as above or, as we will do, use plain JavaScript. It’s up to you. For our little adventure today I’ll use JavaScript and define a single field called “hello” on the mandatory root Query type.

var { GraphQLObjectType, GraphQLString, GraphQLSchema } = require('graphql')
var query = new GraphQLObjectType({
  name: 'Query',
  fields: {
    hello: {type: GraphQLString, resolve: () => 'world'}
  }
})
var schema = new GraphQLSchema({ query })

The queries we receive are written in the GraphQL language, which will be checked against the types and fields we defined in our schema. In the schema above we’ve defined a single field on the Query type, and mapped a function that returns the string ‘world’ to that field.

GraphQL is a language like JavaScript or Python but the inner workings of other languages aren’t usually as visible or approachable as GraphQL.js make them. Looking at how GraphQL works can tell us a lot about how to use it well.

The life of a GraphQL query

Going from a query like { hello } to a JSON response happens in four phases:

  • Lexing
  • Parsing
  • Validation
  • Execution

Let’s take that little { hello } query and see what running it through that function looks like.

Lexing: turning strings into tokens

The query { hello } is a string of characters that presumably make up a valid query in the GraphQL language. The first step in the process is splitting that string into tokens. This work is done with a lexer.

var {createLexer, Source} = require('graphql/language')
var lexer = createLexer(new Source(`{ hello }`))

The lexer can tell us the current token, and we can advance the lexer to the next token by calling lexer.advance()

lexer.token
Tok {
  kind: '',
  start: 0,
  end: 0,
  line: 0,
  column: 0,
  value: undefined,
  prev: null,
  next: null }

lexer.advance()
Tok {
  kind: '{',
  start: 0,
  end: 1,
  line: 1,
  column: 1,
  value: undefined,
  next: null }

lexer.advance()
Tok {
  kind: 'Name',
  start: 1,
  end: 6,
  line: 1,
  column: 2,
  value: 'hello',
  next: null }

lexer.advance()
Tok {
  kind: '}',
  start: 6,
  end: 7,
  line: 1,
  column: 7,
  value: undefined,
  next: null }

lexer.advance()
Tok {
  kind: '',
  start: 7,
  end: 7,
  line: 1,
  column: 8,
  value: undefined,
  next: null }

It’s important to note that we are advancing by token not by character. Characters like commas, spaces, and new lines are all allowed in GraphQL since they make code nice to read, but the lexer will skip right past them in search of the next meaningful token.
These two queries will produce the same tokens you see above.

createLexer(new Source(`{ hello }`))
createLexer(new Source(`    ,,,\r\n{,\n,,hello,\n,},,\t,\r`))

The lexer also represents the first pass of input validation that GraphQL provides. Invalid characters are rejected by the lexer.

createLexer(new Source("*&^%$")).advance()
Syntax Error: Cannot parse the unexpected character "*"

Parsing: turning tokens into nodes, and nodes into trees

Parsing is about using tokens to build higher level objects called nodes.
node
If you look you can see the tokens in there but nodes have more going on.

If you use a tool like grep or ripgrep to search through the source of GraphQL.js you will see where these nodes are coming from. There specialised parsing functions for each type of node, the majority of which are used internally by the parse function. These functions follow the pattern of accepting a lexer, and returning a node.

$ rg "function parse" src/language/parser.js
124:export function parse(
146:export function parseValue(
168:export function parseType(
183:function parseName(lexer: Lexer): NameNode {
197:function parseDocument(lexer: Lexer): DocumentNode {
212:function parseDefinition(lexer: Lexer): DefinitionNode {
246:function parseExecutableDefinition(lexer: Lexer): ExecutableDefinitionNode {
271:function parseOperationDefinition(lexer: Lexer): OperationDefinitionNode {
303:function parseOperationType(lexer: Lexer): OperationTypeNode

Using the parse function is a simple as passing it a GraphQL string. If we print the output of parse with some spacing we can see the what’s actually happening: it’s constructing a tree. Specifically, it’s an Abstract Syntax Tree (AST).

> var { parse } = require('graphql/language')
> console.log(JSON.stringify(parse("{hello}"), null, 2))
{
  "kind": "Document",
  "definitions": [
    {
      "kind": "OperationDefinition",
      "operation": "query",
      "variableDefinitions": [],
      "directives": [],
      "selectionSet": {
        "kind": "SelectionSet",
        "selections": [
          {
            "kind": "Field",
            "name": {
              "kind": "Name",
              "value": "hello",
              "loc": {
                "start": 1,
                "end": 6
              }
            },
            "arguments": [],
            "directives": [],
            "loc": {
              "start": 1,
              "end": 6
            }
          }
        ],
        "loc": {
          "start": 0,
          "end": 7
        }
      },
      "loc": {
        "start": 0,
        "end": 7
      }
    }
  ],
  "loc": {
    "start": 0,
    "end": 7
  }
}

If you play with this, or a more deeply nested query you can see a patten emerge. You’ll see SelectionSets containing selections containing SelectionSets. With a structure like this, a function that calls itself would be able to walk it’s way down the this entire object. We’re all set up for some recursive evaluation.

Validation: Walking the tree with visitors

The reason for an AST is to enable us to do some processing, which is exactly what happens in the validation step. Here we are looking to make some decisions about the tree and how well it lines up with our schema.

For any of that to happen, we need a way to walk the tree and examine the nodes. For that there is a pattern called the Vistor pattern, which GraphQL.js provides an implementation of.

To use it we require the visit function and make a visitor.

var { visit } = require('graphql')

var depth = 0
var vistor = {
  enter: node => {
    depth++
    console.log(' '.repeat(depth).concat(node.kind))
    return node
  },
  leave: node => {
    depth--
    return node
  },
}

Our vistor above has enter and leave functions attached to it. These names are significant since the visit function looks for them when it comes across a new node in the tree or moves on to the next node.
The visit function accepts an AST and a visitor and you can see our visitor at work printing out the kind of the nodes being encountered.

> visit(parse(`{ hello }`, visitor)
 Document
  OperationDefinition
   SelectionSet
    Field
     Name

With the visit function providing a generic ability to traverse the tree, the next step is to use this ability to determine if this query is acceptable to us.
This happens with the validate function. By default, it seems to know that kittens are not a part of our schema.

var { validate } = require('graphql')
validate(schema, parse(`{ kittens }`))
// GraphQLError: Cannot query field "kittens" on type "Query"

The reason it knows that is that there is a third argument to the validate function. Left undefined, it defaults to an array of rules exported from ‘graphql/validation’. These “specifiedRules” are responsible for all the validations that ensure our query is safe to run.

> var { validate } = require('graphql')
> var { specifiedRules } = require('graphql/validation')
> specifiedRules
[ [Function: ExecutableDefinitions],
  [Function: UniqueOperationNames],
  [Function: LoneAnonymousOperation],
  [Function: SingleFieldSubscriptions],
  [Function: KnownTypeNames],
  [Function: FragmentsOnCompositeTypes],
  [Function: VariablesAreInputTypes],
  [Function: ScalarLeafs],
  [Function: FieldsOnCorrectType],
  [Function: UniqueFragmentNames],
  [Function: KnownFragmentNames],
  [Function: NoUnusedFragments],
  [Function: PossibleFragmentSpreads],
  [Function: NoFragmentCycles],
  [Function: UniqueVariableNames],
  [Function: NoUndefinedVariables],
  [Function: NoUnusedVariables],
  [Function: KnownDirectives],
  [Function: UniqueDirectivesPerLocation],
  [Function: KnownArgumentNames],
  [Function: UniqueArgumentNames],
  [Function: ValuesOfCorrectType],
  [Function: ProvidedRequiredArguments],
  [Function: VariablesInAllowedPosition],
  [Function: OverlappingFieldsCanBeMerged],
  [Function: UniqueInputFieldNames] ]

validate(schema, parse(`{ kittens }`), specifiedRules)
// GraphQLError: Cannot query field "kittens" on type "Query"

In there you can see checks to ensure that the query only includes known types (KnownTypeNames) and things like variables having unique names (UniqueVariableNames).
This is the next level of input validation that GraphQL provides.

Rules are just visitors

If you dig into those rules (all in src/validation/rules/) you will realize that these are all just visitors.
In our first experiment with visitors, we just printed out the node kind. If we look at this again, we can see that even our tiny little query ends up with 5 levels of depth.

visit(parse(`{ hello }`, visitor)
 Document  // 1
  OperationDefinition // 2
   SelectionSet // 3
    Field // 4
     Name // 5

Let’s say for the sake of experimentation that 4 is all we will accept. To do that we’ll write ourselves a visitor, and then pass it into the third argument to validate.

var fourDeep = context => {
  var depth = 0, maxDepth = 4 // 😈
  return {
    enter: node => {
      depth++
      if (depth > maxDepth)
        context.reportError(new GraphQLError('💥', [node]))
      }
      return node
    },
    leave: node => { depth--; return node },
  }
}
validate(schema, parse(`{ hello }`), [fourDeep])
// GraphQLError: 💥

If you are building a GraphQL API server, you can take a rule like this and pass it as one of the options to express-graphql, so your rule will be applied to all queries the server handles.

Execution: run resolvers. catch errors.

This us to the execution step. There isn’t much exported from ‘graphql/execution’. What’s worthy of note is here is the root object, and the defaultFieldResolver. This work in concert to ensure that wherever there isn’t a resolver function, by default you get the value for that fieldname on the root object.

var { execute, defaultFieldResolver } = require('graphql/execution')
var args = {
  schema,
  document: parse(`{ hello }`),
  // value 0 in the "value of the previous resolver" chain
  rootValue: {},
  variableValues: {},
  operationName: '',
  fieldResolver: defaultFieldResolver,
}
execute(args)
{
  "data": {
    "hello": "world"
  }
}

Why all that matters

For me the take-away in all this is a deeper appreciation of what GraphQL being a language implies.

First, giving your users a language is empowering them to ask for what they need. This is actually written directly into the spec:

GraphQL is unapologetically driven by the requirements of views and the front‐end engineers that write them. GraphQL starts with their way of thinking and requirements and builds the language and runtime necessary to enable that.

Empowering your users is always a good idea but server resources are finite, so you’ll need to think about putting limits somewhere. The fact that language evaluation is recursive means the amount of recursion and work your server is doing is determined by the person who writes the query. Knowing the mechanism to set limits on that (validation rules!) is an important security consideration.

That caution comes alongside a big security win. Formal languages and type systems are the most powerful tools we have for input validation. Rigorous input validation is one of the most powerful things we can do to increase the security of our systems. Making good use of the type system means that your code should never be run on bad inputs.

It’s because GraphQL is a language that it let’s us both empower users and increase security, and that is a rare combination indeed.

Tagged template literals and the hack that will never go away

Tagged template literals were added to Javascript as part of ES 2015. While a fair bit has been written about them, I’m going to argue their significance is underappreciated and I’m hoping this post will help change that. In part, it’s significant because it strikes at the root of a problem people had otherwise resigned themselves to living with: SQL injection.

Just so we are clear, before ES 2015, combining query strings with untrusted user input to create a SQL injection was done via concatenation using the plus operator.

let query = 'select * from widgets where id = ' + id + ';'

As of ES 2015, you can create far more stylish SQL injections using backticks.

let query = `select * from widgets where id = ${id};`

By itself this addition is really only remarkable for not being included in the language sooner. The backticks are weird, but it gives us some much-needed multiline string support and a very Rubyish string interpolation syntax. It’s pairing this new syntax with another language feature known as tagged templates that has a real potential to make an impact on SQL injections.

> let id = 1
// define a function to use as a "tag"
> sql = (strings, ...vars) => ({strings, vars})
[Function: sql]
// pass our tag a template literal
> sql`select * from widgets where id = ${id};`
{ strings: [ 'select * from widgets where id = ', ';' ], vars: [ 1 ] }

What you see above is just a function call, but it no longer works like other languages. Instead of doing the variable interpolation first and then calling the sql function with select * from widgets where id = 1;, the sql function is called with an array of strings and the variables that are supposed to be interpolated.

You can see how different this is from the standard evaluation process by adding brackets to make this a standard function invocation. The string is interpolated before being passed to the sql function, entirely loosing the distinction between the variable (which we probably don’t trust) and the string (that we probably do). The result is an injected string and an empty array of variables.

> sql(`select * from widgets where id = ${id};`)
{ strings: 'select * from widgets where id = 1;', vars: [] }

This loss of context is the heart of matter when it comes to SQL injection (or injection attacks generally). The moment the strings and variables are combined you have a problem on your hands.

So why not just use parameterized queries or something similar? It’s generally held that good code expresses the programmers intent. I would argue that our SQL injection example code perfectly expresses the programmers intent; they want the id variable to be included in the query string. As a perfect expression of the programmers intent, this should be acknowledged as “good code”… as well as a horrendous security problem.

let query = sql(`select * from widgets where id = ${id};`)

When the clearest expression of a programmers intent is also a security problem what you have is a systemic issue which requires a systemic fix. This is why despite years of security education, developer shaming and “push left” pep-talks SQL injection stubbornly remains “the hack that will never go away”. It’s also why you find Mike Samuel from Google’s security team as the champion of the “Template Strings” proposal.

You can see the fruits of this labour by noticing library authors leveraging this to deliver a great developer experience while doing the right thing for security. Allan Plum, the driving force behind the Arangodb Javascript driver leveraging tagged template literals to let users query ArangoDB safely.

The aql (Arango Query Language) function lets you write what would in any other language be an intent revealing SQL injection, safely returns an object with a query and some accompanying bindvars.

aql`FOR thing IN collection FILTER thing.foo == ${foo} RETURN thing`
{ query: 'FOR thing IN collection FILTER thing.foo == @value0 RETURN thing',
  bindVars: { value0: 'bar' } }

Mike Samuel himself has a number of node libraries that leverage Tagged Template Literals, among them one to safely handle shell commands.

sh`echo -- ${a} "${b}" 'c: ${c}'`

It’s important to point out that Tagged Template Literals don’t entirely solve SQL injections, since there are no guarantees that any particular tag function will do “the right thing” security-wise, but the arguments the tag function receives set library authors up for success.

Authors using them get to offer an intuitive developer experience rather than the clunkiness of prepared statements, even though the tag function may well be using them under the hood. The best experience is from safest thing; It’s a great example of creating a “pit of success” for people to fall into.

// Good security hinges on devs learning to write
// stuff like this instead of stuff that makes sense.
// Clunky prepared statement is clunky.
const ps = new sql.PreparedStatement(/* [pool] */)
ps.input('param', sql.Int)
ps.prepare('select * from widgets where id = @id;', err => {
    // ... error checks
    ps.execute({id: 1}, (err, result) => {
        // ... error checks
        ps.unprepare(err => {
            // ... error checks
        })
    })
})

It’s an interesting thought that Javascripts deficiencies seem to have become it’s strength. First Ryan Dahl filled out the missing IO pieces to create Node JS and now missing features like multiline string support provide an opportunity for some of the worlds most brilliant minds to insert cutting edge security features along-side these much needed fixes.

I’m really happy to finally see language level fixes for things that are clearly language level problems, and excited to see where Mike Samuel’s mission to “make the easiest way to express an idea in code a secure way to express that idea” takes Javascript next. It’s the only way I can see to make “the hack that will never go away” go away.

Basic HTTPS on Kubernetes with Traefik

Back in February of 2018 Google’s Security blog announced that Chrome would be start displaying “not secure” for websites starting in July. In doing so they cemented HTTPS as part of the constantly-rising baseline expectations for modern web developers.

These constantly-rising baseline expectations are written into a new generation of tools like Traefik and Caddy. Both are written in Go and both leverage Let’s Encrypt to automate away the requesting and renewal, and by extension the unexpected expiration, of TLS certificates. Kubernetes is another modern tool aimed at meeting some of the other modern baseline expectations around monitoring, scaling and uptime.

Using Traefik and Kubernetes together is a little fiddly, and getting a working deployment on a cloud provider even more so. The aim here is to show how to use Traefik to get Let’s Encrypt based HTTPS working on the Google Kubernetes Engine.
An obvious prerequisite is to have a domain name, and to point it at a static IP you’ve created.

Let’s start with creating our project:

mike@sleepycat:~$ gcloud projects create --name k8s-https
No project id provided.

Use [k8s-https-212614] as project id (Y/n)?  y

Create in progress for [https://cloudresourcemanager.googleapis.com/v1/projects/k8s-https-212614].
Waiting for [operations/cp.6673958274622567208] to finish...done.

Next lets create a static IP.

mike@sleepycat:~$ gcloud beta compute --project=k8s-https-212614 addresses create k8s-https --region=northamerica-northeast1 --network-tier=PREMIUM
Created [https://www.googleapis.com/compute/beta/projects/k8s-https-212614/regions/northamerica-northeast1/addresses/k8s-https].
mike@sleepycat:~$ gcloud beta compute --project=k8s-https-212614 addresses list
NAME       REGION                   ADDRESS        STATUS
k8s-https  northamerica-northeast1  35.203.65.136  RESERVED

Because I am easily amused, I own the domain actually.works. In my settings for that domain I created an A record pointing at that IP address. When you have things set up correctly, you can verify the DNS part is working with dig

mike@sleepycat:~$ dig it.actually.works

; <<>> DiG 9.13.0 <<>> it.actually.works
;; global options: +cmd
;; Got answer:
;; ->>HEADER<<- opcode: QUERY, status: NOERROR, id: 62565
;; flags: qr rd ra; QUERY: 1, ANSWER: 1, AUTHORITY: 0, ADDITIONAL: 1

;; OPT PSEUDOSECTION:
; EDNS: version: 0, flags:; udp: 4096
;; QUESTION SECTION:
;it.actually.works.		IN	A

;; ANSWER SECTION:
it.actually.works.	3600	IN	A	35.203.65.136

;; Query time: 188 msec
;; SERVER: 192.168.0.1#53(192.168.0.1)
;; WHEN: Tue Aug 07 23:02:11 EDT 2018
;; MSG SIZE  rcvd: 62

With that squared away, we need to create our Kubernetes cluster. Before we can do that we need to get a little administrative stuff out of the way. First we need to get our billing details and link them to our project.

mike@sleepycat:~$ gcloud beta billing accounts list
ACCOUNT_ID            NAME                OPEN  MASTER_ACCOUNT_ID
0X0X0X-0X0X0X-0X0X0X  My Billing Account  True
mike@sleepycat:~$ gcloud beta billing projects link k8s-https-212614 --billing-account 0X0X0X-0X0X0X-0X0X0X
billingAccountName: billingAccounts/0X0X0X-0X0X0X-0X0X0X
billingEnabled: true
name: projects/k8s-https-212614/billingInfo
projectId: k8s-https-212614

Then we’ll need to enable the Kubernetes engine for this project.

mike@sleepycat:~$ gcloud services enable container.googleapis.com --project k8s-https-212614
Waiting for async operation operations/tmo-acf.74966272-39c8-4b7b-b973-8f7fa4dac4fd to complete...
Operation finished successfully. The following command can describe the Operation details:
 gcloud services operations describe operations/tmo-acf.74966272-39c8-4b7b-b973-8f7fa4dac4fd

Let’s create our cluster. Because both Kubernetes and Google move pretty quickly, it’s good to check the current Kubernetes version for your region with something like gcloud container get-server-config --region "northamerica-northeast1". In my case that shows “1.10.5-gke.3” as the newest so I’ll use that for my cluster. If you are interested in beefier machines explore your options with gcloud compute machine-types list --filter="northamerica-northeast1" but for this I’ll slum it with a f1-micro.

mike@sleepycat:~$ gcloud container --project=k8s-https-212614 clusters create "k8s-https" --zone "northamerica-northeast1-a" --username "admin" --cluster-version "1.10.5-gke.3" --machine-type "f1-micro" --image-type "COS" --disk-type "pd-standard" --disk-size "100" --scopes "https://www.googleapis.com/auth/compute","https://www.googleapis.com/auth/devstorage.read_only","https://www.googleapis.com/auth/logging.write","https://www.googleapis.com/auth/monitoring","https://www.googleapis.com/auth/servicecontrol","https://www.googleapis.com/auth/service.management.readonly","https://www.googleapis.com/auth/trace.append" --num-nodes "3" --enable-cloud-logging --enable-cloud-monitoring --addons HorizontalPodAutoscaling,HttpLoadBalancing,KubernetesDashboard --enable-autoupgrade --enable-autorepair

Creating cluster k8s-https...done.
Created [https://container.googleapis.com/v1/projects/k8s-https-212614/zones/northamerica-northeast1-a/clusters/k8s-https].
To inspect the contents of your cluster, go to: https://console.cloud.google.com/kubernetes/workload_/gcloud/northamerica-northeast1-a/k8s-https?project=k8s-https-212614
kubeconfig entry generated for k8s-https.
NAME       LOCATION                   MASTER_VERSION  MASTER_IP    MACHINE_TYPE  NODE_VERSION  NUM_NODES  STATUS
k8s-https  northamerica-northeast1-a  1.10.5-gke.3    35.203.64.6  f1-micro      1.10.5-gke.3  3          RUNNING

You will notice that kubectl (which you obviously have installed already) is now configured to access this cluster.
As part of the Traefik setup we are about to do we will need to change some RBAC rules. To do that we will need to create a cluster admin role and load that into our cluster.

mike@sleepycat:~$ cat cluster-admin-rolebinding.yaml 
---
apiVersion: rbac.authorization.k8s.io/v1beta1
kind: ClusterRoleBinding
metadata:
  name: owner-cluster-admin-binding
roleRef:
  apiGroup: rbac.authorization.k8s.io
  kind: ClusterRole
  name: cluster-admin
subjects:
- apiGroup: rbac.authorization.k8s.io
  kind: User
  name: <your_username@your_email_you_use_with_google_cloud.whatever>
---

mike@sleepycat:~$ kubectl apply -f cluster-admin-rolebinding.yaml

With that done we can apply the rest of the config I’ve posted in a snippet here with kubectl apply -f https.yaml.
It’s a fair bit of yaml, but a few things are worth pointing out.

First, we are running a single pod with my helloworld image. It’s just the output of create-react-app that I use for testing stuff.
If you look at the traefik-ingress-service, you will notice we are telling Google we want the service mapped to the static IP we created earlier using loadBalancerIP.

---
apiVersion: v1
kind: Service
metadata:
  name: traefik-ingress-service
  namespace: kube-system
spec:
  loadBalancerIP: 35.203.65.136
  ports:
  - name: http
    port: 80
    protocol: TCP
  - name: https
    port: 443
    protocol: TCP
  - name: admin
    port: 8080
    protocol: TCP
  selector:
    k8s-app: traefik-ingress-lb
  type: LoadBalancer
---

When looking at the traefik-ingress-controller itself, it’s worth noting the choice of kind: Deployment instead of kind: DaemonSet. This choice was made for simplicity’s sake (only a single pod will read/write to my certs-claim volume so no Multi-Attach errors), and means that I will have a single pod acting as my ingress controller. Read more about the tradeoffs here.

Here is the traefik-ingress-controller in it’s entirety. It’s a long chunk of code, but I find this helps see everything in context.

Special note about the args being passed to the container; make sure they are strings. You can end up with some pretty baffling errors if you don’t. Other than that, it’s the full set of options to get you TLS certs and automatic redirects to HTTPS.

---
apiVersion: extensions/v1beta1
kind: Deployment
metadata:
  labels:
    k8s-app: traefik-ingress-lb
  name: traefik-ingress-controller
  namespace: kube-system
spec:
  template:
    metadata:
      labels:
        k8s-app: traefik-ingress-lb
    spec:
      containers:
      - args:
        - "--api"
        - "--kubernetes"
        - "--logLevel=DEBUG"
        - "--debug"
        - "--defaultentrypoints=http,https"
        - "--entrypoints=Name:http Address::80 Redirect.EntryPoint:https"
        - "--entrypoints=Name:https Address::443 TLS"
        - "--acme"
        - "--acme.onhostrule"
        - "--acme.entrypoint=https"
        - "--acme.domains=it.actually.works"
        - "--acme.email=mike@korora.ca"
        - "--acme.storage=/certs/acme.json"
        - "--acme.httpchallenge"
        - "--acme.httpchallenge.entrypoint=http"
        image: traefik:1.7
        name: traefik-ingress-lb
        ports:
        - containerPort: 80
          hostPort: 80
          name: http
        - containerPort: 443
          hostPort: 443
          name: https
        - containerPort: 8080
          hostPort: 8080
          name: admin
        securityContext:
          capabilities:
            add:
            - NET_BIND_SERVICE
            drop:
            - ALL
        volumeMounts:
        - mountPath: /certs
          name: certs-claim
      serviceAccountName: traefik-ingress-controller
      terminationGracePeriodSeconds: 60
      volumes:
      - name: certs-claim
        persistentVolumeClaim:
          claimName: certs-claim

The contents of the snippet should be all you need to get up and running. You should be able to visit your domain and see the reassuring green of the TLS lock in the URL bar.

A TLS certificate from Let's Encrypt

If things aren’t working you can get a sense of what’s up with the following commands:

kubectl get all --all-namespaces
kubectl logs --namespace=kube-system traefik-ingress-controller-...

Where to go from here

As you can see, there is a fair bit going on here. We have DNS, Kubernetes, Traefik and the underlying Google Cloud Platform all interacting and it’s not easy to get a minimal “hello world” style demo going when that is the case. Hopefully this shows enough to give people a jumping off point so they can start refining this into a more robust configuration. The next steps for me will be exploring DaemonSets and storing the acme.json in a way that multiple copies of Traefik can access, maybe a key/value like consul. We’ll see what the next layer of learning brings.

Minimum viable Kubernetes

I remember sitting in the audience at the first Dockercon in 2014 when Google announced Kubernetes and thinking “what kind of a name is that?”. In the intervening years, Kubernetes, or k8s for short, has battled it out with Cattle and Docker swarm and emerged as the last orchestrator standing.

I’ve been watching this happen but have been procrastinating on learning it because from a distance it looks hella complicated. Recently I decided to rip off the bandaid and set myself the challenge of getting a single container running in k8s.

While every major cloud provider is offering k8s, so far Google looks to be the easiest to get started with. So what does it take to get a container running on Google Cloud?

First some assumptions: you’ve installed the gcloud command (I used this) with the alpha commands, and you have a GCP account, and you’ve logged in with gcloud auth login.

If you have that sorted, let’s create a project.

mike@sleepycat:~$ gcloud projects create --name projectfoo
No project id provided.

Use [projectfoo-208401] as project id (Y/n)?  

Create in progress for [https://cloudresourcemanager.googleapis.com/v1/projects/projectfoo-208401].
Waiting for [operations/cp.4790935341316997740] to finish...done.

With a project created we need to enable billing for it, so Google can charge you for the compute resources Kubernetes uses.

                                                                                                                                      
mike@sleepycat:~$ gcloud alpha billing projects link projectfoo-208401 --billing-account 0X0X0X-0X0X0X-0X0X0X
billingAccountName: billingAccounts/0X0X0X-0X0X0X-0X0X0X
billingEnabled: true
name: projects/projectfoo-208401/billingInfo
projectId: projectfoo-208401

Next we need to enable the Kubernetes Engine API for our new project.

mike@sleepycat:~$ gcloud services --project=projectfoo-208401 enable container.googleapis.com
Waiting for async operation operations/tmo-acf.445bb50c-cf7a-4477-831c-371fea91ddf0 to complete...
Operation finished successfully. The following command can describe the Operation details:
 gcloud services operations describe operations/tmo-acf.445bb50c-cf7a-4477-831c-371fea91ddf0

With that done, we are free to fire up a Kubernetes cluster. There is a lot going on here, more than you need, but it’s good to be able to see some of the options available. Probably the only ones to care about initially are the zone and the machine-type.

mike@sleepycat:~$ gcloud beta container --project=projectfoo-208401 clusters create "projectfoo" --zone "northamerica-northeast1-a" --username "admin" --cluster-version "1.8.10-gke.0" --machine-type "f1-micro" --image-type "COS" --disk-type "pd-standard" --disk-size "100" --scopes "https://www.googleapis.com/auth/compute","https://www.googleapis.com/auth/devstorage.read_only","https://www.googleapis.com/auth/logging.write","https://www.googleapis.com/auth/monitoring","https://www.googleapis.com/auth/servicecontrol","https://www.googleapis.com/auth/service.management.readonly","https://www.googleapis.com/auth/trace.append" --num-nodes "3" --enable-cloud-logging --enable-cloud-monitoring --addons HorizontalPodAutoscaling,HttpLoadBalancing,KubernetesDashboard --enable-autoupgrade --enable-autorepair
This will enable the autorepair feature for nodes. Please see
https://cloud.google.com/kubernetes-engine/docs/node-auto-repair for more
information on node autorepairs.

This will enable the autoupgrade feature for nodes. Please see
https://cloud.google.com/kubernetes-engine/docs/node-management for more
information on node autoupgrades.

Creating cluster projectfoo...done.                                                                                                                                                                         
Created [https://container.googleapis.com/v1beta1/projects/projectfoo-208401/zones/northamerica-northeast1-a/clusters/projectfoo].
To inspect the contents of your cluster, go to: https://console.cloud.google.com/kubernetes/workload_/gcloud/northamerica-northeast1-a/projectfoo?project=projectfoo-208401
kubeconfig entry generated for projectfoo.
NAME        LOCATION                   MASTER_VERSION  MASTER_IP     MACHINE_TYPE  NODE_VERSION  NUM_NODES  STATUS
projectfoo  northamerica-northeast1-a  1.8.10-gke.0    35.203.8.163  f1-micro      1.8.10-gke.0  3          RUNNING

With that done we can take a quick peek at what that last command created: a Kubernetes cluster on three f1-micro VMs.

mike@sleepycat:~$ gcloud compute instances --project=projectfoo-208401 list
NAME                                       ZONE                       MACHINE_TYPE  PREEMPTIBLE  INTERNAL_IP  EXTERNAL_IP    STATUS
gke-projectfoo-default-pool-190d2ac3-59hg  northamerica-northeast1-a  f1-micro                   10.162.0.4   35.203.87.122  RUNNING
gke-projectfoo-default-pool-190d2ac3-lbnk  northamerica-northeast1-a  f1-micro                   10.162.0.2   35.203.78.141  RUNNING
gke-projectfoo-default-pool-190d2ac3-pmsw  northamerica-northeast1-a  f1-micro                   10.162.0.3   35.203.91.206  RUNNING

Let’s put those f1-micro‘s to work. We are going to use the kubectl run command to run a simple helloworld container that just has the basic output of create-react-app in it.

mike@sleepycat:~$ kubectl run projectfoo --image mikewilliamson/helloworld --port 3000
deployment "projectfoo" created

The result of that is the helloworld container, running inside a pod, inside a replica set inside a deployment, which of course is running inside a VM on Google Cloud. All that’s needed now is to map the port the container is listening on (3000) to port 80 so we can talk to it from the outside world.

mike@sleepycat:~$ kubectl expose deployment projectfoo --type LoadBalancer --port 80 --target-port 3000
service "projectfoo" exposed

This creates a LoadBalancer service, and eventually we get allocated our own IP.

mike@sleepycat:~$ kubectl get services
NAME         TYPE           CLUSTER-IP     EXTERNAL-IP   PORT(S)        AGE
kubernetes   ClusterIP      10.59.240.1    <none>        443/TCP        3m
projectfoo   LoadBalancer   10.59.245.55   <pending>     80:32184/TCP   34s
mike@sleepycat:~$ kubectl get services
NAME         TYPE           CLUSTER-IP     EXTERNAL-IP      PORT(S)        AGE
kubernetes   ClusterIP      10.59.240.1    <none>           443/TCP        4m
projectfoo   LoadBalancer   10.59.245.55   35.203.123.204   80:32184/TCP   1m

Then we can use our newly allocated IP and talk to our container. The moment of truth!

mike@sleepycat:~$ curl 35.203.123.204
<!DOCTYPE html><html lang="en"><head><meta charset="utf-8"><meta name="viewport" content="width=device-width,initial-scale=1,shrink-to-fit=no"><meta name="theme-color" content="#000000"><link rel="manifest" href="/manifest.json"><link rel="shortcut icon" href="/favicon.ico"><title>React App</title><link href="/static/css/main.c17080f1.css" rel="stylesheet"></head><body><noscript>You need to enable JavaScript to run this app.</noscript><div id="root"></div><script type="text/javascript" src="/static/js/main.61911c33.js"></script></body></html>

After you’ve taken a moment to marvel at the layers of abstractions involved here, it’s worth remembering that you probably don’t want this stuff hanging around if you aren’t really using it, otherwise you’re going to regret connecting your billing information.

mike@sleepycat:~$ gcloud container --project projectfoo-208401 clusters delete projectfoo
The following clusters will be deleted.
 - [projectfoo] in [northamerica-northeast1-a]

Do you want to continue (Y/n)?  y

Deleting cluster projectfoo...done.                                                                                                                                                                         
Deleted [https://container.googleapis.com/v1/projects/projectfoo-208401/zones/northamerica-northeast1-a/clusters/projectfoo].
mike@sleepycat:~$ gcloud projects delete projectfoo-208401
Your project will be deleted.

Do you want to continue (Y/n)?  y

Deleted [https://cloudresourcemanager.googleapis.com/v1/projects/projectfoo-208401].

You can undo this operation for a limited period by running:
  $ gcloud projects undelete projectfoo-208401

There is a lot going on here, and since this is new territory, much of it doesn’t mean lots to me yet. What’s exciting to me is finally being able to get a toe-hold on an otherwise pretty intimidating subject.

Having finally started working with it, I have to say both the kubectl and gcloud CLI tools are thoughtfully designed and pretty intuitive, and Google’s done a nice job making a lot of stuff happen in just a few approachable commands. I’m excited to dig in further.

Customizing your R command line experience

I’ve come to appreciate how powerful R is for working with data, but I find it has some pretty awkward and clunky defaults that make every interaction with the command line kind of aggravating.

mike@sleepycat:~$ R

R version 3.4.3 (2017-11-30) -- "Kite-Eating Tree"
Copyright (C) 2017 The R Foundation for Statistical Computing
Platform: x86_64-pc-linux-gnu (64-bit)

R is free software and comes with ABSOLUTELY NO WARRANTY.
You are welcome to redistribute it under certain conditions.
Type 'license()' or 'licence()' for distribution details.

  Natural language support but running in an English locale

R is a collaborative project with many contributors.
Type 'contributors()' for more information and
'citation()' on how to cite R or R packages in publications.

Type 'demo()' for some demos, 'help()' for on-line help, or
'help.start()' for an HTML browser interface to help.
Type 'q()' to quit R.

> install.packages("tidyverse")
Warning in install.packages("tidyverse") :
  'lib = "/usr/lib/R/library"' is not writable
Would you like to use a personal library instead?  (y/n)
>
Save workspace image? [y/n/c]: n

Here you can see a few things that I’m not a fan of. First up, uppercase commands are just weird. Second, holy moly that’s a lot of blah blah to give me a repl.

Next, this warning about the non-writable directory; /usr will always be read only and owned by root. Why even try to write there?

Accepting the offer to use a “personal library” translates to creating a directory like ~/R/x86_64-pc-linux-gnu-library/3.4, which is another annoyance. Why isn’t this a hidden directory? Why must I be forced to look at this R directory every time I see my home folder?

Finally, if I’m doing something more than a quick experiment, I’ll write a script in a text file so I can track changes to it with git rather than saving my work in some opaque .RData file. Given that, having R always asking to save my workspace is deeply irritating.

We can pick off a few of these problems with a simple alias, by adding the following to your ~/.bashrc file:

alias r="R --no-save --quiet"

This immediately gives us a far more civilized experience getting in and out of R: I can launch R with a lowercase r command and then exit without a fuss with Ctrl+d (signaling the end of input). The --quiet kills the introductory text while --no-save gets rid of the “Save workspace image?” nag.

mike@sleepycat:~$ r
> 
mike@sleepycat:~$

This is a good start but goofy stuff like where to save your libraries will need to be solved another way: your Rprofile. While starting up R looks for certain configuration files one of them being ~/.Rprofile.

I’ve created a hidden folder called .rlibs folder in my home directory which my Rprofile then sets as my chosen place to save libraries among a few other things likes setting a default mirror and loading and saving my command history.

Here is what’s working for me:

# Load utils so we can use it here.
library(utils)

# Save R libraries into my /home/$USER/.rlibs instead of somewhere that
# requires root privileges:
.libPaths('~/.rlibs')

# Stop asking me about mirrors, and always use the https
# cran mirror at muug.ca:
local({r <- getOption("repos")
      r["CRAN"] <- "https://muug.ca/mirror/cran/"
      options(repos=r)})

# Some reasonable defaults:
options(stringsAsFactors=FALSE)
options(max.print=100)
options(editor="vim")
options(menu.graphics=FALSE)
Sys.setenv(R_HISTFILE="~/.Rhistory")
Sys.setenv(R_HISTSIZE="100000")

# Run at startup
.First <- function(){
  # Load my history if this is an interactive session
  if (interactive()) utils::loadhistory(file = "~/.Rhistory")
  # Load the packages in the tidyverse without warnings.
  # suppressMessages(library(tidyverse))
}

# Run at the end of your session
.Last <- function(){
  if (interactive()) utils:::savehistory(file = "~/.Rhistory")
}

This little foray into R configuration has made R really nice to use from the command line. Hopefully this will be a decent starting point for others as well.